NMAT 2026 Quiz 36: Data Interpretation

Three products P, Q, R, are sold in three stores S1, S2, and S3. The table below gives the discount percentage and the selling prices of the products in the three stores:


S1

S2

S3

Product

Discount

%

Selling

Price

Discount

%

Selling

Price

Discount

%

Selling

Price

P

10

1440

10

1350

8

1150

Q

6

2820

12

2640

15

2550

R

18

3075

20

3600

16

3150

Q1. If Store 1 sold 30, 40, and 20 units of P, Q, and R, respectively, how much revenue did it lose in offering discounts? Correct Option 1 … Explanation: Marked price = Selling price ÷ (1 − discount rate). In S1, the marked price of P = 1440 ÷ 0.90 = 1600, so the discount per unit = 160. The marked price of Q = 2820 ÷ 0.94 = 3000, so the discount per unit = 180. The marked price of R = 3075 ÷ 0.82 = 3750, so the discount per unit = 675. Total discount = (30 × 160) + (40 × 180) + (20 × 675) = 4800 + 7200 + 13500 = 25,500. Hence, option 1. Q2. If each store made a profit of 20% on article R, what is the maximum difference between the cost and marked price in the three stores? Correct Option 2 … Explanation: Cost price = Selling price ÷ 1.2 and Marked price = Selling price ÷ (1 − discount rate). S1: cost = 3075 ÷ 1.2 = 2562.5, marked price = 3075 ÷ 0.82 = 3750, difference = 1187.5. S2: cost = 3600 ÷ 1.2 = 3000, marked price = 3600 ÷ 0.80 = 4500, difference = 1500. S3: cost = 3150 ÷ 1.2 = 2625, marked price = 3150 ÷ 0.84 = 3750, difference = 1125. The maximum difference is 1500, in S2. Hence, option 2. Q3. The difference between the discount offered in stores S1 and S2 for product P is Rs. 34000. If store S1 sold double the units of P as compared to S2, how many units of P did S1 sell? Correct Option 1 … Explanation: The discount per unit of P in S1 = (1440 ÷ 0.90) − 1440 = 160. The discount per unit of P in S2 = (1350 ÷ 0.90) − 1350 = 150. Let S2 sell x units, so S1 sells 2x units. Then 160(2x) − 150x = 34000, so 170x = 34000 and x = 200. S1 sold 2x = 400 units. Hence, option 1. Q4. What is the average marked price of Q in the three stores? Correct Option 4 … Explanation: The marked price of Q in S1 = 2820 ÷ 0.94 = 3000. In S2 = 2640 ÷ 0.88 = 3000. In S3 = 2550 ÷ 0.85 = 3000. Average marked price = (3000 + 3000 + 3000) ÷ 3 = 3000. Hence, option 4.

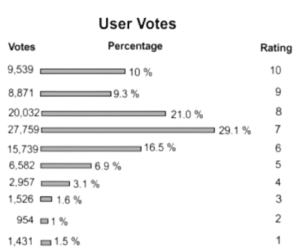
Q5. How many users voted? Correct Option 5 … Explanation: Each user could vote only once, so the total number of users equals the sum of the votes across all ratings in the graph, which is 95,390. Hence, option 5. Q6. Exactly 12% of the number of voters who gave a rating of 5 or below were below 18 years of age. How many users who gave a rating of 5 or below were below 18 years of age? Correct Option 2 … Explanation: The votes for ratings 1 to 5 in the graph total 13,450. The number of these voters below 18 years of age = 12% of 13,450 = 1,614. Hence, option 2. Q7. What is the average rating given by the users? Correct Option 3 … Explanation: Average rating = Σ(rating × number of votes for that rating) ÷ total votes. Applying this weighted average to the graph, with total votes of 95,390, gives 7.096. Hence, option 3. Q8. What was the rating given by almost half the users? Correct Option 4 … Explanation: Half of the 95,390 users is about 47,695. According to the graph, the combined votes for ratings 7 and 8 come closest to this figure. Hence, option 4.

The table gives the cost structure for packaged food products—Potato Chips, Jam and Packaged Juice. All the data pertains to the N grams packet of each of the three products. MRP = maximum retail price = the price at which the retailer sells the article to the customer.

Cost Component

Potato Chips

Jam

Packaged Juice

MRP

10.00

50.00

68.00

Retailer’s Margin + Discount

0.83

7.20

11.80

Distributor’s Margin

0.44

2.18

3.50

Sales Tax

0.94

5.37

8.20

Excise Duty

1.04

0.00

0.00

Distribution

0.41

2.81

2.70

Returns

0.27

1.06

0.68

Manufacturing Cost

1.10

0.87

5.10

Packaging Cost

1.50

6.18

12.60

Raw Material Cost

1.25

9.52

5.80

Q9. What percentage of the MRP is the retailer's margin in the case of packaged juice? Correct Option 5 … Explanation: The table gives only the combined figure for "Retailer's Margin + Discount", which is 11.80 for packaged juice. Since the margin and the discount are not shown separately, the retailer's margin alone cannot be calculated. Hence, option 5. Q10. A distributor sells 5 packets of potato chips, 12 packets of jam and 8 packets of packaged juice (N grams of each). What is his total margin for these items (INR)? Correct Option 4 … Explanation: The distributor's margin per packet is 0.44 for potato chips, 2.18 for jam and 3.50 for packaged juice. Total margin = (5 × 0.44) + (12 × 2.18) + (8 × 3.50) = 2.20 + 26.16 + 28.00 = 56.36. Hence, option 4. Q11. For which of the following items is the raw material cost, as a percentage of MRP, the maximum? Correct Option 1 … Explanation: Raw material cost as a percentage of MRP is: Potato chips = 1.25 ÷ 10 = 12.5%; Jam = 9.52 ÷ 50 = 19.04%; Packaged juice = 5.80 ÷ 68 ≈ 8.53%. Jam has the highest percentage. Hence, option 1. Q12. If there is no sales tax, then the price of which of the following products will come down over MRP by the maximum percentage? Correct Option 3 … Explanation: Removing sales tax lowers the price by the amount of the tax, so the percentage fall equals sales tax as a percentage of MRP: Potato chips = 0.94 ÷ 10 = 9.4%; Jam = 5.37 ÷ 50 = 10.74%; Packaged juice = 8.20 ÷ 68 ≈ 12.06%. Packaged juice shows the largest fall. Hence, option 3.

5 students appeared in a competitive exam that had two papers: Paper 1 and Paper 2. Each correct answer in both papers fetched 1 mark, and there was no negative marking.

1) The passing marks in Paper 1 and Paper 2 are 60% and 50%, respectively.

2) Ben scored 75 in Paper 1, and Duke scored 110 in Paper 2.

3) Both Adam and Corey scored 10 more marks in Paper 2 than in Paper 1.

4) Duke and Corey scored 70% and 80% of the total marks in Paper 1, respectively.

5) The marks of Adam in Paper 2 is 20 more than the marks of Evan in Paper 1.

6) Evan and Adam failed in Paper 1 and Paper 2 by 10 marks and 5 marks, respectively.

7) The marks of Corey in Paper 1 are 40% of the total marks of Duke and Corey in Paper 2.
Q13. What are the passing marks in Paper 2? Correct Option 3 … Explanation: Let Corey's Paper 1 score be c, so his Paper 2 score is c + 10. From statement 7, c = 0.4(110 + c + 10), which gives c = 80. Since 80 is 80% of the Paper 1 total, that total is 100 and the Paper 1 pass mark is 60. Evan failed Paper 1 by 10, so he scored 50. Adam's Paper 2 score = 50 + 20 = 70. Adam failed Paper 2 by 5, so the Paper 2 pass mark = 70 + 5 = 75. Hence, option 3. Q14. If Ben and Evan had the same total, what could be the maximum average of the 5 persons in Paper 2? Correct Option 4 … Explanation: The Paper 2 pass mark of 75 is 50% of the total, so Paper 2 is out of 150. The known Paper 2 scores are Adam = 70, Corey = 90 and Duke = 110. In Paper 1, Ben scored 75 and Evan scored 50. Equal totals mean 75 + Ben's Paper 2 score = 50 + Evan's Paper 2 score, so Evan's Paper 2 score is 25 more than Ben's. The average is highest when Evan scores the maximum of 150, which makes Ben's score 125. Maximum average = (70 + 125 + 90 + 110 + 150) ÷ 5 = 545 ÷ 5 = 109. Hence, option 4. Q15. What are the total marks scored by Corey? Correct Option 1 … Explanation: From statement 7, Corey's Paper 1 score c satisfies c = 0.4(110 + c + 10), which gives c = 80. From statement 3, his Paper 2 score = 80 + 10 = 90. Corey's total = 80 + 90 = 170. Hence, option 1. Q16. What is the average score of the 5 people in paper 1? Correct Option 5 … Explanation: Paper 1 is out of 100. The scores are Adam = 70 − 10 = 60 (statement 3), Ben = 75, Corey = 80, Duke = 70% of 100 = 70, and Evan = 60 − 10 = 50. Average = (60 + 75 + 80 + 70 + 50) ÷ 5 = 335 ÷ 5 = 67. Hence, option 5.

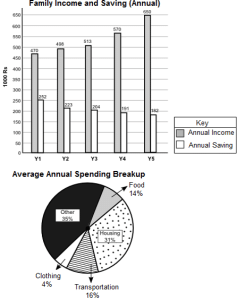
Q17. On which item did the family spend between Rs 1 lakh and Rs 1.2 lakh annually in Y4? Correct Option 2 … Explanation: Spending in a year = Income − Savings. Applying each category's pie chart percentage to the Y4 spending shows that only Housing falls between Rs 1 lakh and Rs 1.2 lakh. Hence, option 2. Q18. What was the total increase in the amount of money the family spent annually on buying food and clothing in Y2 over Y1? Correct Option 1 … Explanation: Spending in a year = Income − Savings. The increase in food and clothing spending = (Y2 spending − Y1 spending) × combined pie chart share of food and clothing. This works out to Rs 10,260. Hence, option 1. Q19. In which year did the family spend a total of exactly Rs 60,640 on transportation? Correct Option 4 … Explanation: Transportation spending in a year = (Income − Savings) × transportation's pie chart share. Applying this to each year shows that the amount equals exactly Rs 60,640 in Y4. Hence, option 4. Q20. The annual family spending in the year preceding Y1 was Rs 150,000. Which year recorded the lowest percentage increase in the annual family spending over the preceding year? Correct Option 3 … Explanation: Spending in each year = Income − Savings. Taking Rs 150,000 as the base for Y1, the percentage increase for each year = (Current year's spending − Preceding year's spending) ÷ Preceding year's spending × 100. The lowest percentage increase occurs in Y3. Hence, option 3.